Customer Refunds Monitoring
Enable easier monitoring of customer refunds throughout their lifecycle.
Outcome
- Consolidated refunds into one investigation view, replacing spreadsheet exports and ad-hoc checks so support and ops can move from “what happened?” to “what to do next?”
- Turned a static table into a workbench with scoped filters, search, and clear statuses to speed up triage and reducing duplicate work
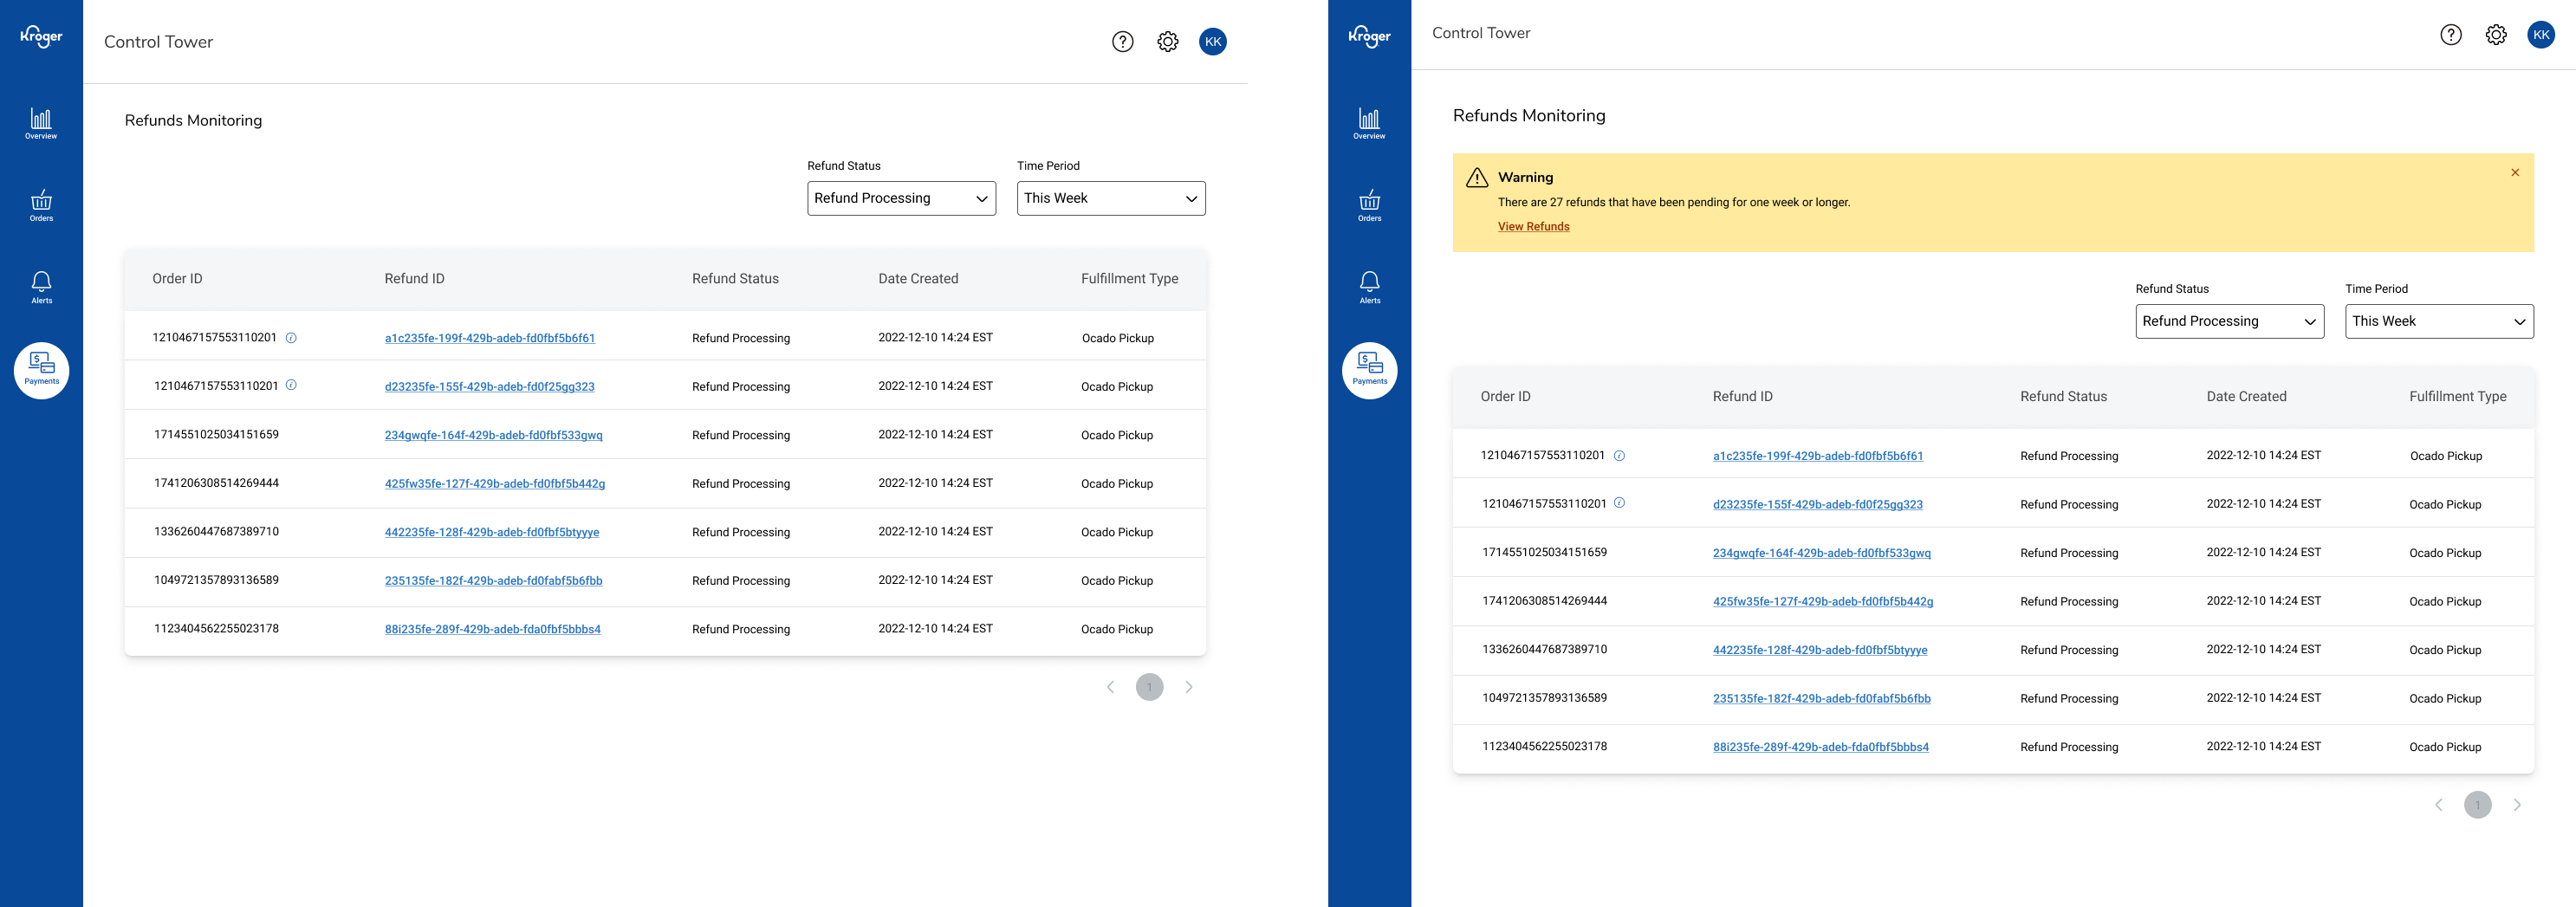
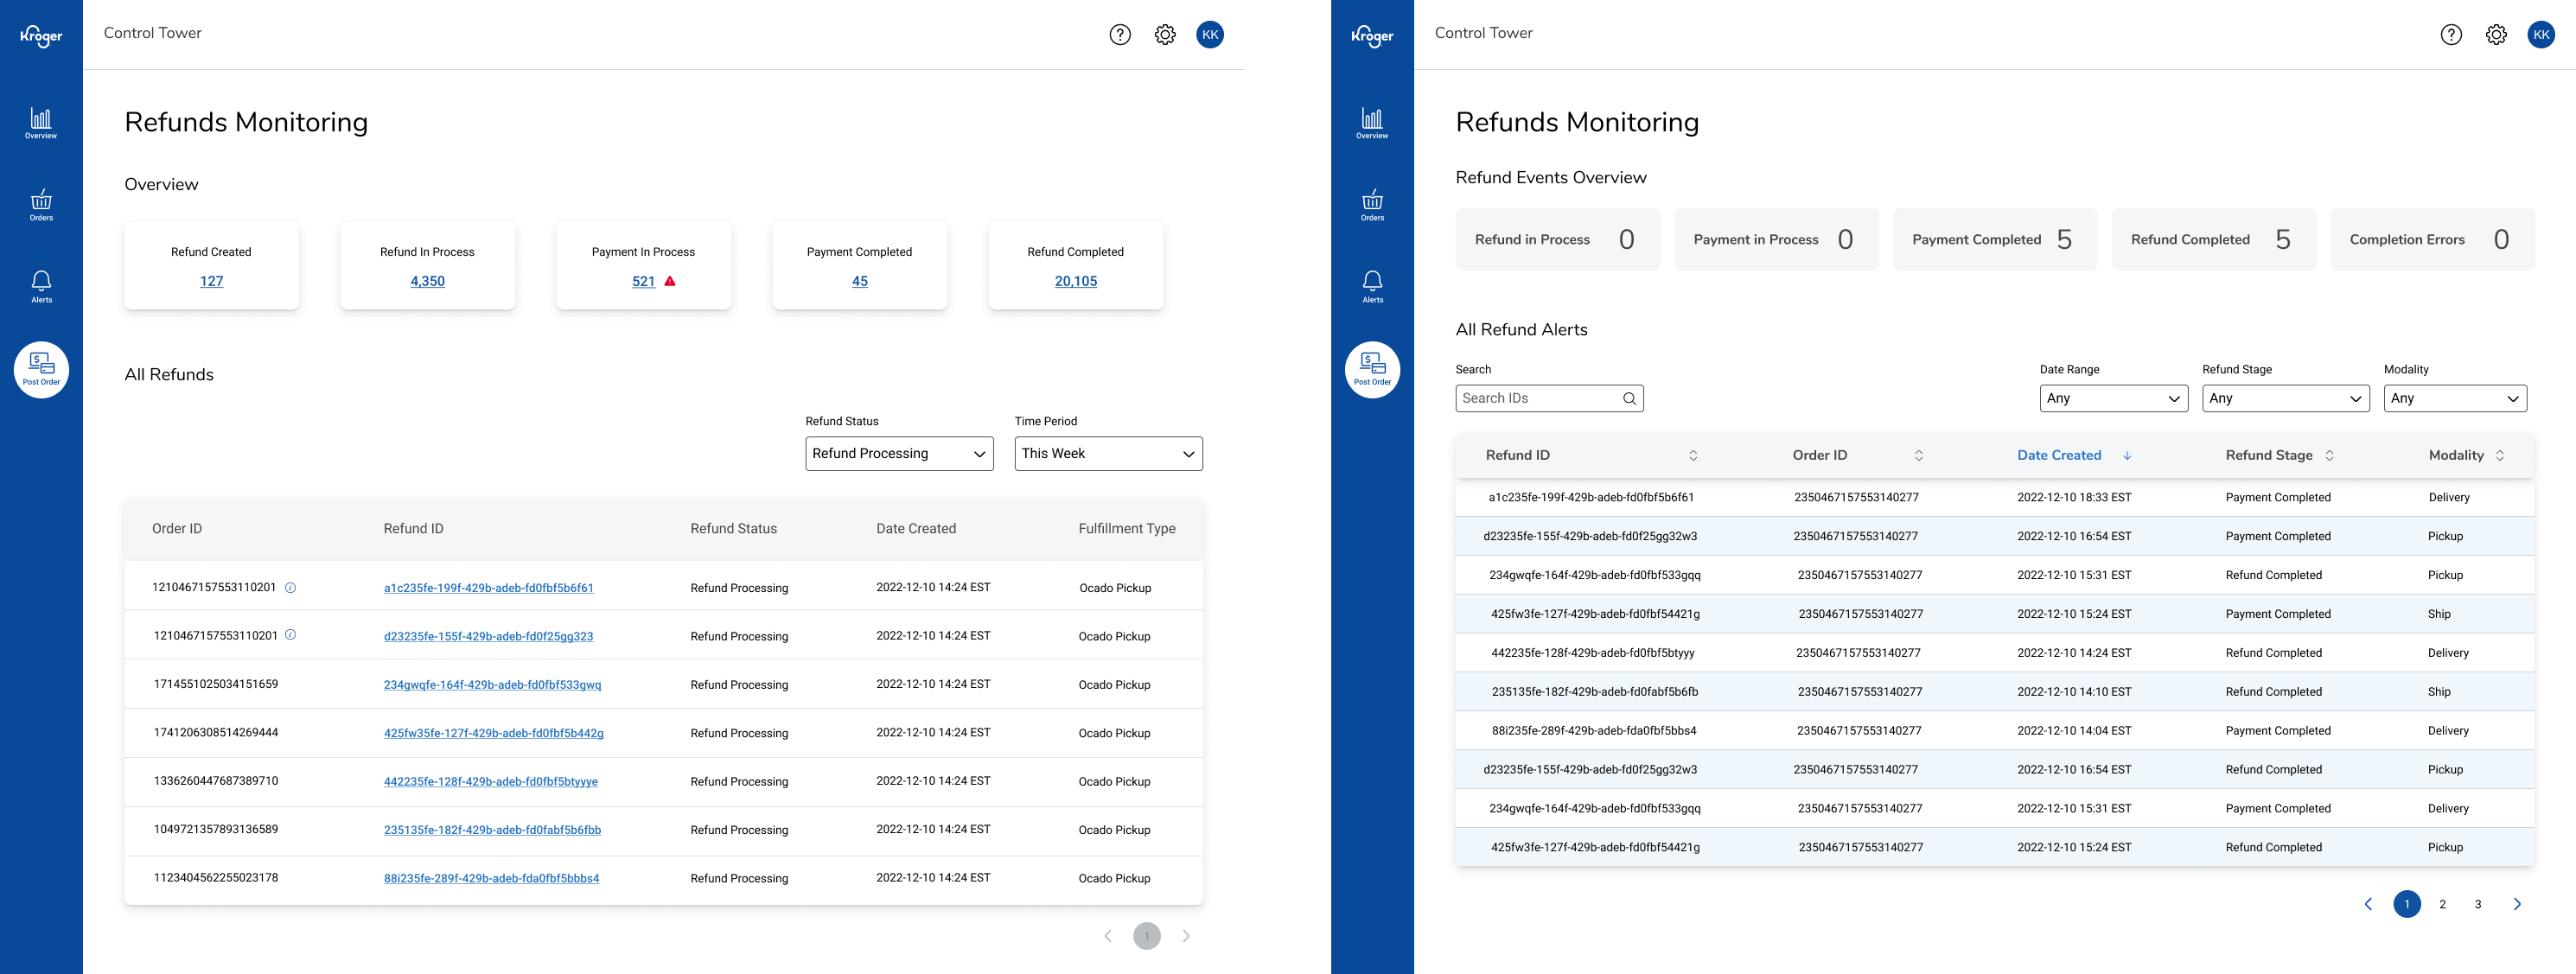
Evolution of the default screen
Details
Desktop internal tool · Lead product designer · Figma · E-commerce operations/post-purchase
Problem
Refunds were monitored via periodic CSVs and siloed dashboards. People couldn’t easily spot anomalies (spikes, repeat offenders) or drill from a summary into a specific order and back again without losing context. The result: slow triage, duplicate investigations, and missed patterns.
Approach
I mapped real investigation flows with support leads, identified the core questions (who/when/why/how much) and designed a table-first workbench with scoped filters, pinned columns, and row-level actions. I added search for spot checks and status chips to reflect investigation state. We started with a dozen common views (e.g., high-value refunds, repeat issuers). We paired with engineering on query performance and added empty/edge states so “no result” still points to a next step.
Key Decisions
- Inline drill-in to keep context while reviewing order details
- Status chips + bulk actions to move many items forward quickly
Result & Impact
- Cut error identification and time to resolve to same-day
- Enabled group monitoring of refunds instead of a single point
- We promoted these into the design system (chips, saved-view picker) to reduce custom one-offs
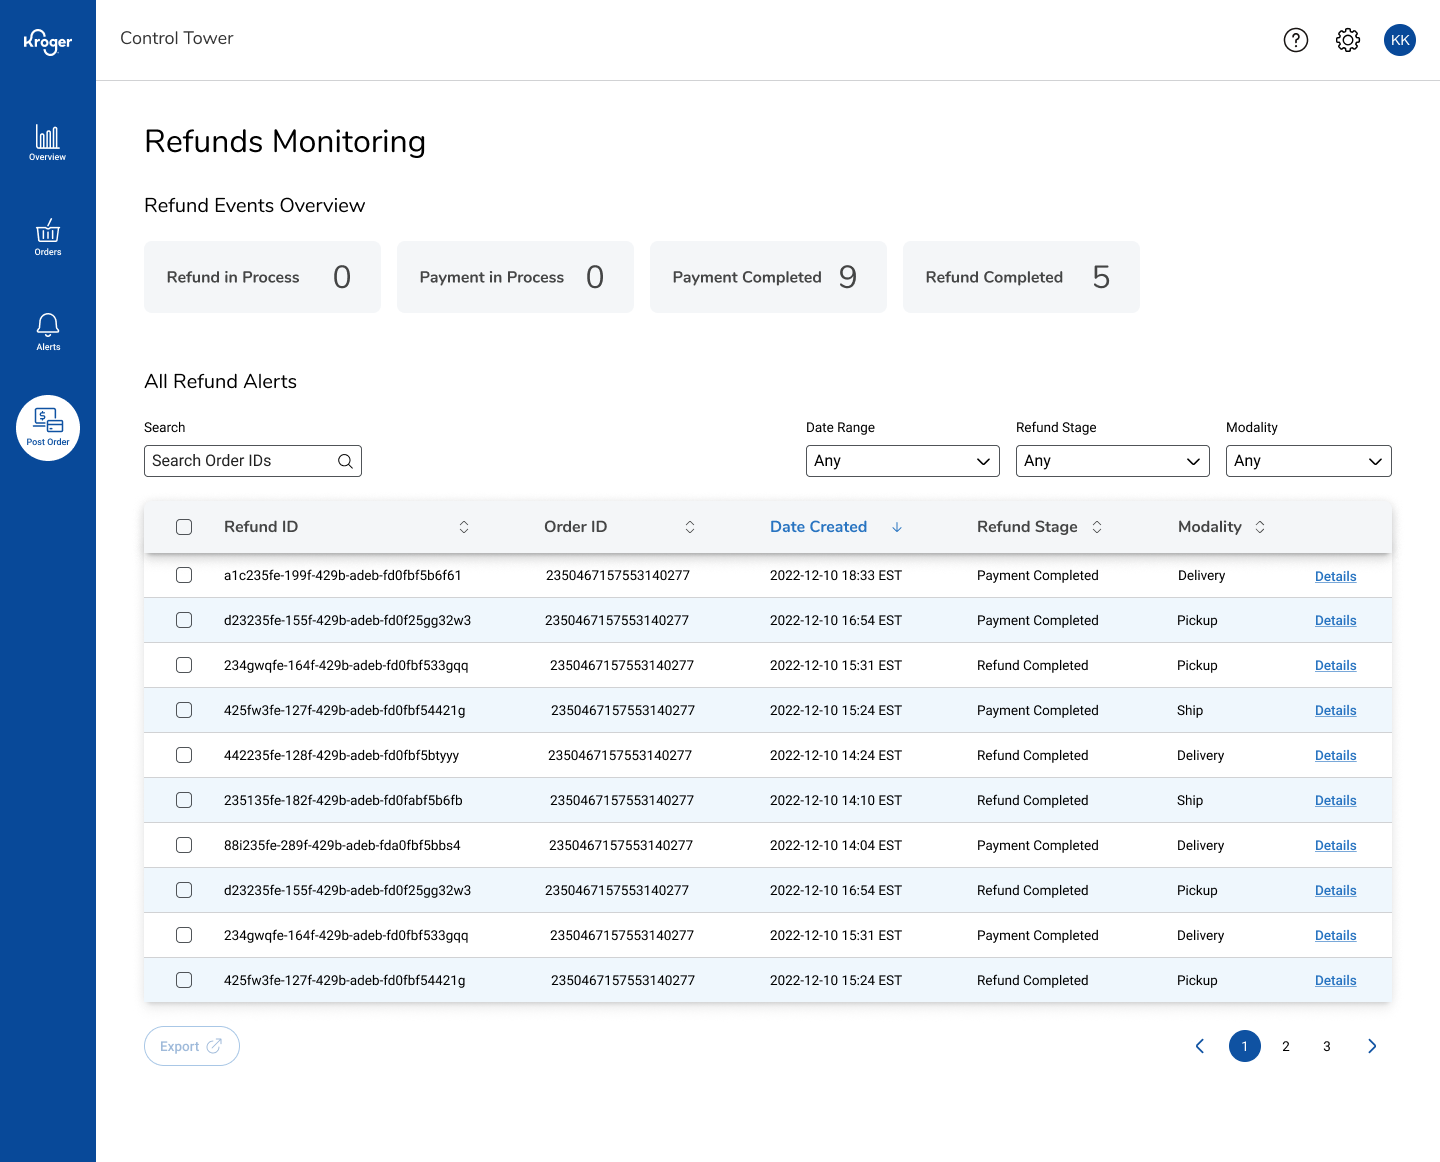
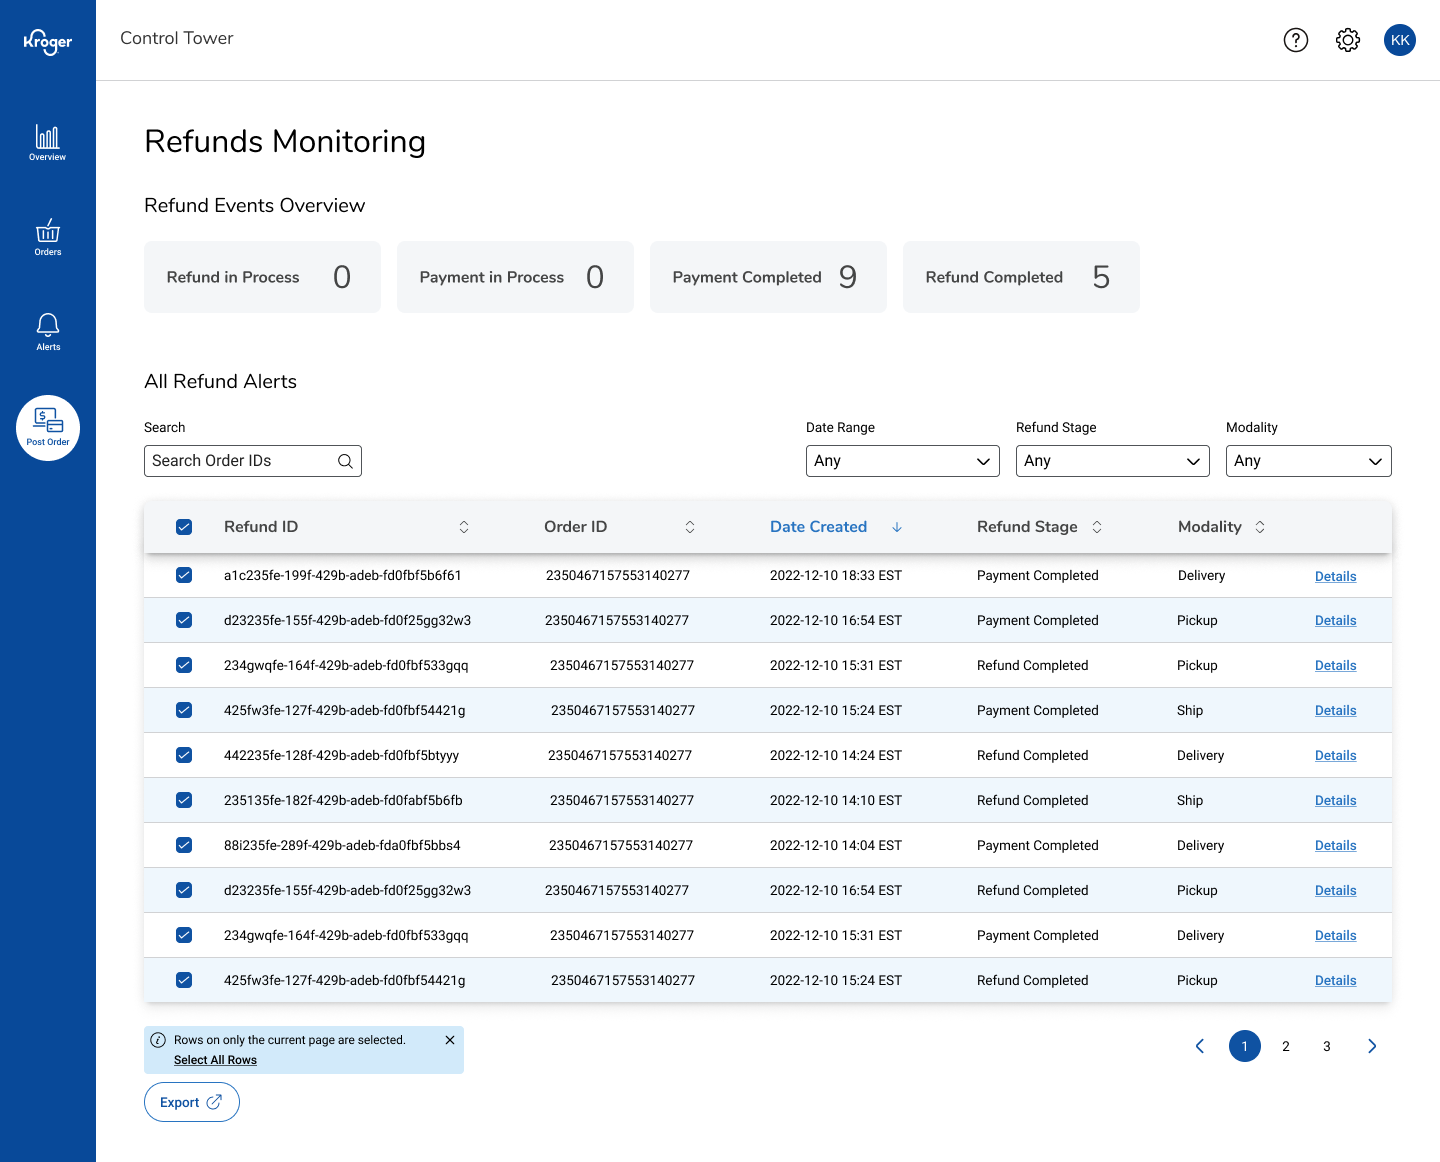
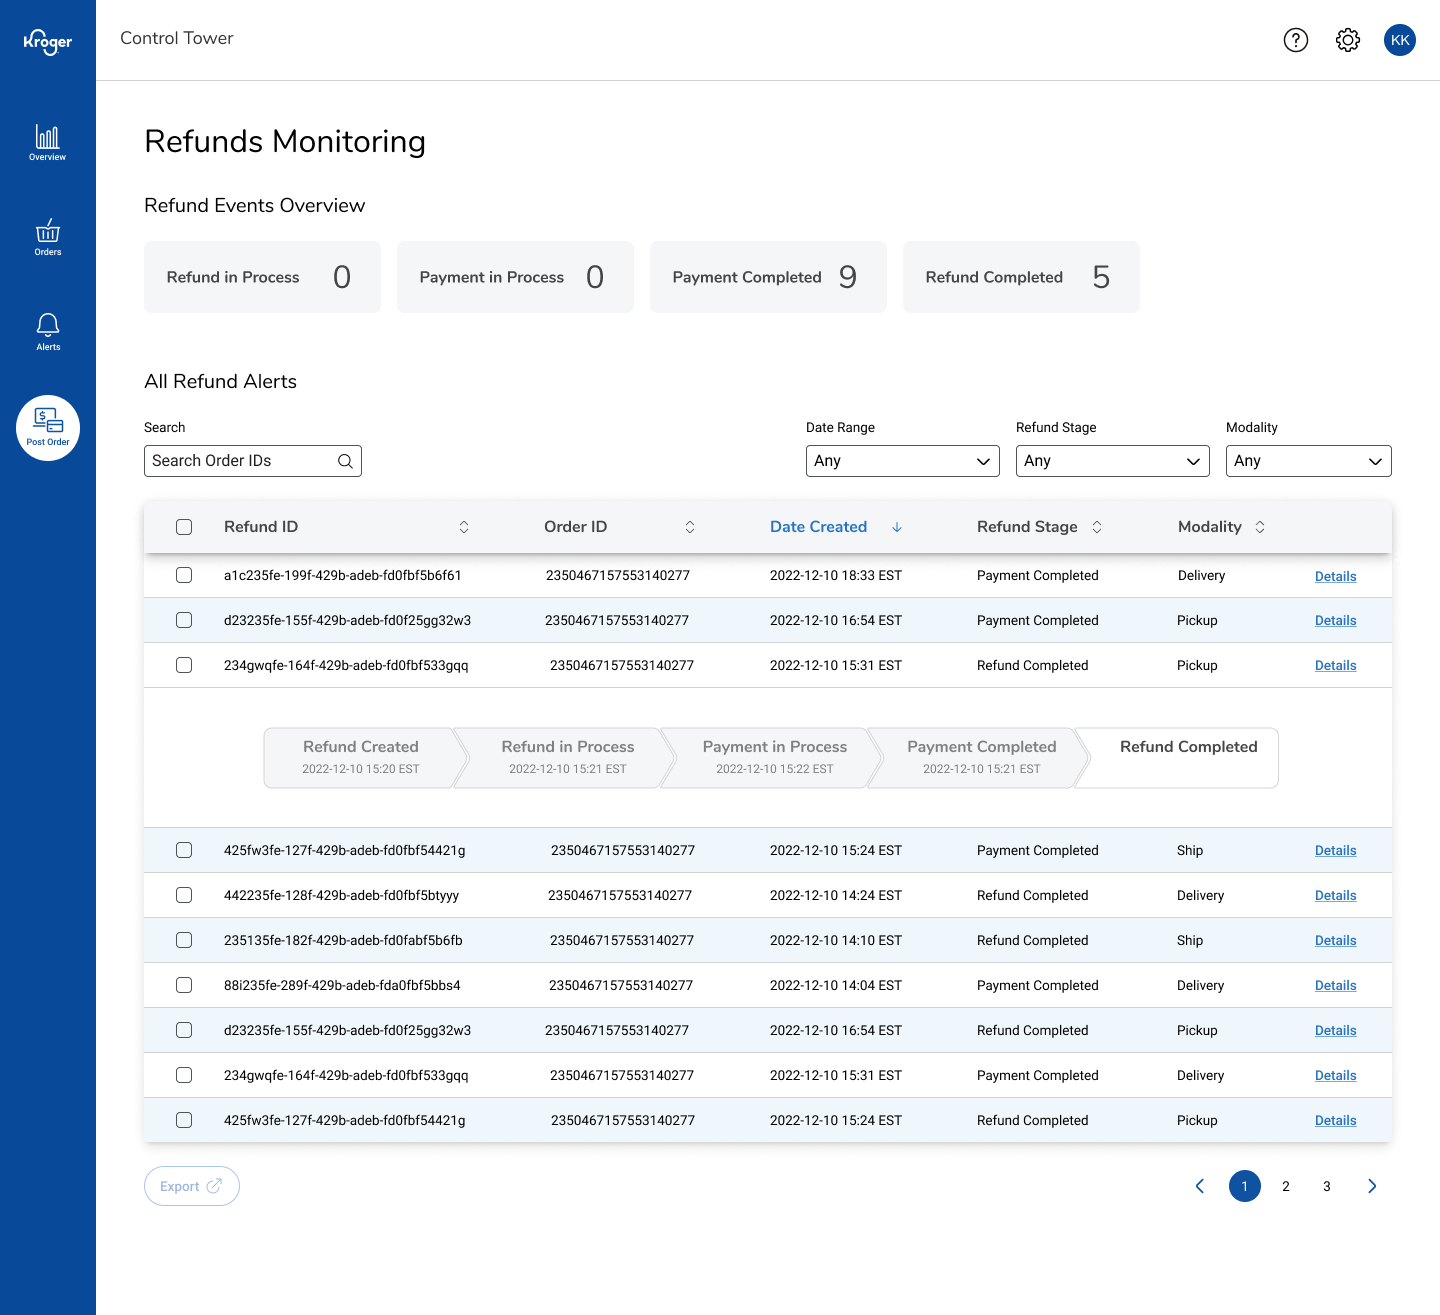
A few final screens (Default, Export, Expanded)
What I’d Improve Next
Anomaly alerts, saved views, embedded order detail information